The standard deviation is one of the important terms in the study of the subject of statistics. The standard deviation is a statistical term used for determining to what extent fluctuations or dispersion there is in a set of data values. It is measured as the difference between the data points and the mean (average) value.
It is frequently used to observe and understand the range of data. A greater standard deviation signifies the dispersion or spread of the data points, whereas a smaller standard deviation shows the degree of variation in the data set or given data information precisely.
In this comprehensive detail, we will describe the concept of the standard deviation for ungrouped data with a complete guide on how to solve the problems of the standard deviation for ungrouped data. We will elaborate on this comprehensive concept with the help of solved examples.
Standard Deviation (SD)
An assessment of the variation or dispersion in a collection of data values is made using a statistical metric known as the standard deviation. The mean (average) value is often used to understand the distribution of data points around it.
The formula used to find the standard deviation can differ depending on whether you are using a sample or the entire population. There are two variations of the standard deviation formula: one for the entire population and another for a particular portion or sample.
The sample standard deviation (SSD) is used when we have the data on a subset of the population data values and the population standard deviation (PSD) is used when we have data on the entire population.
How to Calculate SD for Ungrouped Data
A list of values that may or may not be categorized makes up the raw ungrouped data. The standard deviation is then determined using the relevant formula either there is to compute sample standard deviation or population standard deviation.
Explanation
The degree to which each observation deviates from the mean is expressed as a standard deviation. The positive would exactly balance the negative if the disparities were to be combined, giving a sum of zero and as a result, we sum up all the squares of the deviations.
The sum of the squares is then divided by the number of observations minus one to determine the mean of the squares. The square root is then applied for converting the data to its original units. (To get the mean square, use “degrees of freedom” and divide by the number of observations minus one instead of the total number of observations.) In this case, they are one less than the total.
Mathematically,
For population Standard deviation:
σ = √ [Σ (xk – μ)2 / N]
Where Σ is the sigma or summation sign and u is the mean for population data. Moreover, N is the size of the population data.
For sample standard deviation:
Sk = √ [Σ (xk – x̅)2 / (N – 1)]
Example Section:
Example 1: Determine what the standard deviation for the following ungrouped data given in the table that represents the number of passed candidates in the CSS exam from different districts:
| City | A | B | C | D | E | F |
| X | 1 | 2 | 4 | 7 | 9 | 12 |
Solution:
Step 1: Determine the mean for the given data in the above table.
x̅ = μ= (1 + 2 + 4 + 7 + 9 + 12) / 6
x̅ = μ= 35 / 6
x̅ = μ = 5.8333
Step 2: Now we will do the following necessary computations to get the desired result.
| x | xk – x̅ = xk – μ | (xk – x̅)2 = (xk – μ)2 |
| 1 | -4.83 | 23.3289 |
| 2 | -3.83 | 14.6689 |
| 4 | -1.83 | 3.3489 |
| 7 | 1.17 | 1.3489 |
| 9 | 3.17 | 10.0489 |
| 12 | 6.17 | 38.0689 |
| Σ | 90.8334 |
Step 3: Formula for population SD:
σ = √ [Σ (xk – μ)2 / N]
σ = √ [(90.8334) / 6]
σ = √ (15.1389)
σ = 3.8909 Ans.
Step 4: Formula for sample SD:
Sk = √ [Σ (xk – x̅)2 / (N – 1)]
Sk = √ [(90.8334) / (6 – 1)]
Sk = √ (90.8334) / 5
Sk = √ (18.1667)
Sk = 4.26
Example 2: Determine the standard deviation for the set of numbers given in the table that shows the marks of a candidate in his annual exam.
| Subject | Eng | Ur | IS | PS | Math | Phy | Chem | Bio |
| Marks (xk) | 29 | 31 | 28 | 29 | 31 | 46 | 39 | 31 |
Solution:
Step 1: Mean of the marks:
x̅ = μ= (29 + 31+ 28 + 29 + 31 + 46 + 39 + 31) / 8
x̅ = μ= 264 / 8
x̅ = μ = 33
Step 2: Now we will do the following necessary computations to get the desired result.
| x | xk – x̅ = xk – μ | (xk – x̅)2 = (xk – μ)2 |
| 29 | -4 | 16 |
| 31 | -2 | 4 |
| 28 | -5 | 25 |
| 29 | -4 | 16 |
| 31 | -2 | 4 |
| 46 | 13 | 169 |
| 39 | 6 | 36 |
| 31 | -2 | 4 |
| Σ | 274 |
Step 3: Formula for population SD:
σ = √ [Σ (xk – μ)2 / N]
σ = √ [(274) / 8]
σ = √ (34.25)
σ = 5.8524 Ans.
Step 4: Formula for sample SD:
Sk = √ [Σ (xk – x̅)2 / (N – 1)]
Sk = √ [(274) / (8 – 1)]
Sk = √ (274) / 7
Sk = √ (39.1429)
Sk = 6.2564
A mean standard deviation calculator could be used as an alternative to find sample or population STD to get rid of lengthy manual solutions.
Wrap Up:
In this comprehensive guide, we have addressed the topic of the standard deviation for in details. We have elaborated on how to compute the standard deviation for ungrouped data. We have explained a complete guide with solved examples to determine the population standard deviation and sample standard deviation if there is given ungrouped data. We hope that by reading this article you can solve problems about standard deviation easily.
Related posts
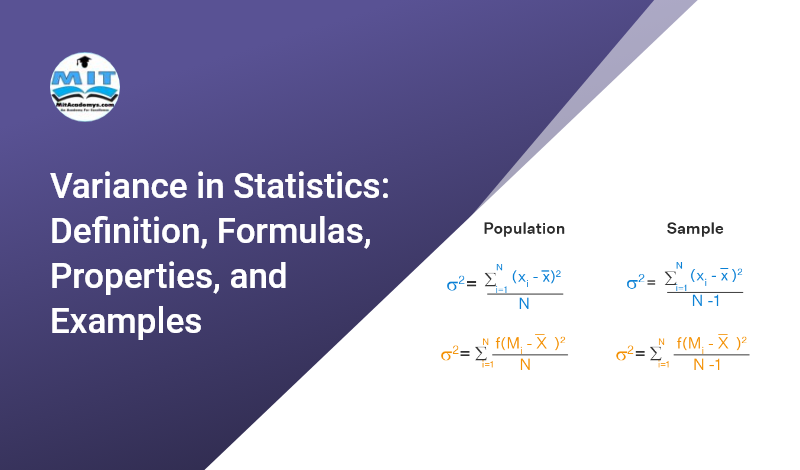
 Variance in Statistics: Definition, Formulas, Properties, and Examples
 Concept of Critical Value with the help of Different Techniques to find it
 About Libre office.
 Apache Open Office.
 Heron’s Formula Class 9th
 Operators In C Language.
 Operators In C Programming Hindi.
 About Microsoft office 2016
 Coordinate Geometry (Analytical Geometry) Class 10th
 About Pandas
 About Microsoft Office 2013 Pro Plus.
 Arithmetic Progression Class 10th
 Polynomials Class 10th
 Quadratic Equation Class 10th
 About Microsoft Office 2013 Pro Plus Hindi.
बहुपद कक्षा 10 (Polynomial Class 10th)
About Microsoft Office 2013 Pro Plus Hindi.
बहुपद कक्षा 10 (Polynomial Class 10th)
 Learn Html5
 Section Formula Class 10th
 About Libre office In Hindi.
 Everything About Microsoft Windows 10.
 Sum of First n Terms of an Arithmetic Progression Class 10th
 About Microsoft office 2016 Hindi
 Learn Java Programming
 nth Term (General Term) of an Arithmetic Progression Class 10th
 Trigonometry Class 10th
 Learn C Programming
 त्रिकोणमिति कक्षा 10 (The Trigonometry Class 10th)
 Distance Between Two Points in Cartesian Plane and Distance Formula Class 10th
 Learn Html
 About MongoDb Database
हीरोन का सूत्र कक्षा 9 (Heron’s Formula Class 9th)
About MongoDb Database
हीरोन का सूत्र कक्षा 9 (Heron’s Formula Class 9th)
 About Microsoft Windows 7.
 About Raspberry pi board
 What Is Tailwind Css
 About Python Tableau
 Learn Java Script Programming
 Everything About Microsoft Windows 10 Hindi.
 Apache Open Office Hindi.
 Quadratic Formula (Shridharacharya Sutra) Class 10th
 Linux, What is Linux, A Complete Overview of Ubuntu Linux.
निर्देशांक ज्यामिति कक्षा 10 (The Coordinate Geometry Class 10th)
Linux, What is Linux, A Complete Overview of Ubuntu Linux.
निर्देशांक ज्यामिति कक्षा 10 (The Coordinate Geometry Class 10th)
 विभाजन सूत्र कक्षा 10 (The Section Formula Class 10th)
 What Is Bootstrap Css
 Triangle and its Properties Class 10th
कार्तीय समतल में दो बिन्दुओं के बीच की दूरी और दूरी सूत्र कक्षा 10 (The Distance Formula Class 10th)
Triangle and its Properties Class 10th
कार्तीय समतल में दो बिन्दुओं के बीच की दूरी और दूरी सूत्र कक्षा 10 (The Distance Formula Class 10th)
 Microsoft Windows 10 Operating System Apps.
 About Vue.js
 About mysql
 About Scala Programming
 About ReactJs Framework
 About C# Programming
 What Is Bulma Css
 Area of Triangle in Coordinate Geometry Class 10th
 About Python Numpy
 About Json json javascript object notation
 Mensuration Q & A
 What is Linux, A Complete Overview of Ubuntu Linux Hindi.
 Microsoft Windows Legacy Operating system.
 About Scipy Python Library
 समान्तर श्रेढ़ी कक्षा 10 (Arithmetic Progressions Class 10th)
 About Arduino Microcontroller Board
 Microsoft Windows 8 Apps.
 About Postgresql
 Perimeter and Area Class 6th
 What Is Express.js
 What is Nodejs
 About Xml
द्विघात समीकरण कक्षा 10 (Quadratic Equations Class 10th)
About Xml
द्विघात समीकरण कक्षा 10 (Quadratic Equations Class 10th)
 HTML Semantic Elements
 Angle Subtended by a Chord of Circle Class 10th
 त्रिभुज और इसके गुण कक्षा 10 (The Triangle and its Properties Class 10th)
 About Pl/Sql
 Geometrical (Graphical) Meaning of the Zeroes of a Polynomial Class 10th
 Data Type In C Programming Hindi.
 Areas Related to Circles Class 10th
 HTML Document Structure
 About Microsoft office 365.
 Representation of Real Numbers on the Number Line Class 9th
 Pc assembly and its operation.
 Linear Equations in Two Variables Class 9th
 बहुपद के शून्यकों का ज्यामितीय (आलेखीय) अर्थ कक्षा 10 [Geometrical (Graphical) Meaning of the Zeroes of the Polynomial Class 10th]
 About Microsoft Windows 7 Hindi.
 About Joomla Cms
 About Typescript Language
 Midpoint – Definition, Formula, Applications, And Examples
 Data Type In C Programming.
 About Magento Programming
 Sets Class 11th
 HTML Semantic Elements In Hindi
परिमाप और क्षेत्रफल कक्षा 6 (Perimeter and Area for Class 6th)
HTML Semantic Elements In Hindi
परिमाप और क्षेत्रफल कक्षा 6 (Perimeter and Area for Class 6th)
 Tangent and Secant of Circle Class 10th
 About Perl Programming
 Coordinate Geometry Class 9th
 Operations on Real Numbers Class 9th
 Html Forms and Input Elements in Hindi
 Microsoft Windows 10 Apps Hindi.
 About Kotlin Programming
 Decimal Expansion of Rational Numbers Class 10th
 What Is A Search Engine and Their Type?
 समान्तर श्रेढ़ी के पहले n पदों का योग कक्षा 10 (Sum of n Terms of Arithmetic Progression Class 10th)
 समुच्चय कक्षा 11 (The Sets Class 11th)
 Microsoft Windows Legacy Operating System Hindi.
 वास्तविक संख्याओं पर संक्रियाएँ कक्षा 9वीं (Operations on Real Numbers Class 9th)
 About Delphi Programming
 About Wps Office.
 Introduction to Euclid’s Geometry Class 9th
 वृत्त की स्पर्श रेखा और छेदक रेखा कक्षा 10 (Tangent and Secant of Circles Class 10th)
 निर्देशांक ज्यामिति कक्षा 9 (The Coordinate Geometry Class 9th)
 HTML Elements
 About Sql – Structure Query Language
 Type of Computer Programming.
 About Go Programming Language
 Decimal Numbers Class 7th
 Angle Subtended by the Arc of a Circle Class 10th
 Pair of Linear Equations in Two Variables Class 10th
 Euclid’s Division Lemma Class 10th
 Html Forms and Input Elements
 दशमलव संख्याएँ कक्षा 7 (Decimal Number Class 7th)
 About Asp.net
 What is Angular Js
 समान्तर श्रेढ़ी का n वाँ पद (व्यापक पद) कक्षा 10 (nth Term of Arithmetic Progression Class 10th)
 Microsoft Windows 8 Apps Hindi.
 What Is A Search Engine and Their Type In Hindi?
 यूक्लिड की ज्यामिति का परिचय कक्षा 9 (Introduction to Euclid’s Geometry Class 9th)
 Probability Class 10th
 Computer Fundamental.
 Cyclic Quadrilaterals Class 10th
 वृत्त की जीवा द्वारा अंतरित कोण कक्षा 10 (Angle Made by a Chord of Circle Class 10th)
 Pc assembly and its operation Hindi.
 10 Approved Steps for Choosing the Best Web Design that Fit for Your Business
 Polynomials Class 9th
 What Is Differential Calculus? Its Definition, Rules, and Examples
 दो चरों वाले रैखिक समीकरण कक्षा 9 (Linear Equations of two Variables Class 9th)
 Decimal Expansions of Real Numbers Class 9th
 Integers Class 6th
 Computer Motherboard and its Components.
 The Fundamental Theorem of Arithmetic Class 10th
 About Dart Programming
 Circumference of Circle Class 10th
 Growth of the Internet.
 दो चर वाले रैखिक समीकरण युग्म कक्षा 10 (Pair of Linear Equations in Two Variables Class 10th)
 Operations on Polynomials Class 10th
 बहुपदों पर संक्रियाएँ कक्षा 10 (Operation on Polynomial Class 10th)
 पूर्णांक संख्याएँ कक्षा 6 (Integer Class 6th)
 Whole Numbers Class 6th
पूर्ण संख्याएँ कक्षा 6 (Whole Number Class 6th)
Whole Numbers Class 6th
पूर्ण संख्याएँ कक्षा 6 (Whole Number Class 6th)
 An In-Depth Review of imagestotext.io in 2023
 HTML Elements In Hindi
 HTML Document Structure In Hindi