The variance is a widely used concept in probability and descriptive statistics for measuring the variability of the given data. The variance is a technique for determining the various terms in finance. It is just the same as the standard deviation but it is measured in squared units.
Let us explore the term variance.
What is the Variance in Statistics?
Variance can be defined as the statistical measure of the deviation between numbers in a dataset. The variance of a set measures how far each number is from the expected value (mean), as well as from the other numbers.
The result of the variance is the square of the standard deviation. The term standard deviation is another statistical technique that measures the average of the squared deviations. Symbolically, the term variance can be written as s2, σ2, or Var(x).
The data set in the variance could be population or sample. The sample data is a set of sample values taken from the whole population to measure the estimated value. Whereas the population data set is the set of a whole number of values such as the population taking the whole data.
There are two main kinds of variance:
- Sample Variance
- Population Variance
Formulas of Variance
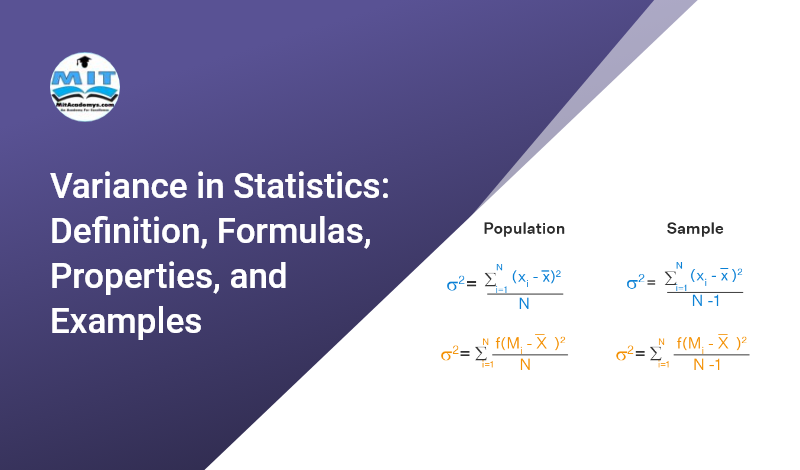
The formulas for the sample and population variance are:
| For population variance | For sample variance |
| σ2 = [∑(xi – μ)2/N] | s2 = [∑(xi – x̄)2/(N – 1)] |
| > σ2 is the notation of population variance. > μ is the average value of the population data. > Xi is the set of given data values. > N is the total number of observations. | > s2 is the notation of sample variance. > x̄ is the average value of sample data. > Xi is the set of given data values. > N is the total number of observations. |
Advantages of Variance
There are some advantages and disadvantages of the variance. Let us discuss them briefly.
| Advantages |
| It is used to measure the relationship among the numbers and the average values to make work easier for statisticians as the other way is rather difficult such as arranging numbers into quartiles. |
| The deviations from the expected values are treated the same in the variance regardless of their direction. |
| There is no variability at all in data as the square of deviations can’t sum to zero. |
Properties of Variance
Some properties of the variance are:
1) The sum of the constant term with variance should skip constant terms such as:
Var(X + C) = Var(X)
2) The product of a constant term with variance should take out the square of the constant term. Such as
Var(C * X) = C2 * Var(X)
3) Similarly, the product and sum of a constant term with variance should take out the square of the constant term. Such as
Var(aX + b) = a2 * Var(X)
4) The variance should be applied to each term separately if the random variables X1, X2, …, Xn are given such as
Var(X1, X2, …, Xn) = Var(X1) + Var(X2) +……..+Var(Xn)
Examples of Variance
Below are a few examples of variance.
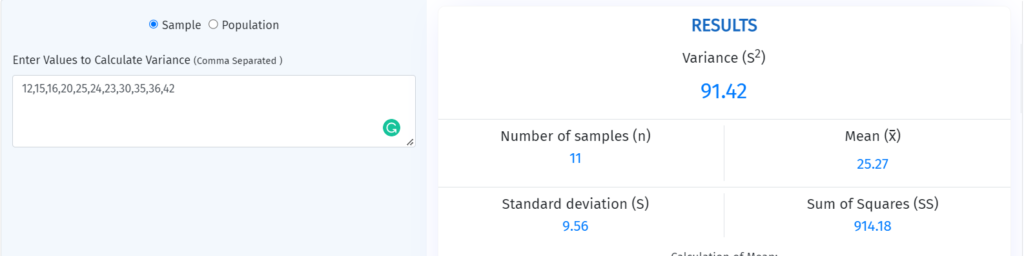
Example 1: For Sample Variance
Measure the variability in the given sample data.
Sample data = 12, 15, 16, 20, 25, 24, 23, 30, 35, 36, 42
Solution –
Step 1: First of all, find the sample average value by taking the quotient of the sum of observations and the total number of data values.
Sum of sample data = 12 + 15 + 16 + 20 + 25 + 24 + 23 + 30 + 35 + 36 + 42
Sum = 278
Total number of observation = N = 11
Sample Mean = 278/11
Sample Mean = 25.27
Step 2: Now find the deviation (difference of each data value from the average).
| Data values | zi – z̄ |
| 12 | 12 – 25.27 = -13.27 |
| 15 | 15 – 25.27 = -10.27 |
| 16 | 16 – 25.27 = -9.27 |
| 20 | 20 – 25.27 = -5.27 |
| 25 | 25 – 25.27 = -0.27 |
| 24 | 24 – 25.27 = -1.27 |
| 23 | 23 – 25.27 = -2.27 |
| 30 | 30 – 25.27 = 4.73 |
| 35 | 35 – 25.27 = 9.73 |
| 36 | 36 – 25.27 = 10.73 |
| 42 | 42 – 25.27 = 16.73 |
Step 3: Now take the square of the deviations to make all the results positive.
| (zi – z̄)2 |
| (-13.27)2 = 176.09 |
| (-10.27)2 = 105.47 |
| (-9.27)2 = 85.93 |
| (-5.27)2 = 27.77 |
| (-0.27)2 = 0.07 |
| (-1.27)2 = 1.61 |
| (-2.27)2 = 5.15 |
| (4.73)2 = 22.37 |
| (9.73)2 = 94.67 |
| (10.73)2 = 115.13 |
| (16.73)2 = 279.89 |
Step 4: Now take the sum of the squared deviations.
∑(zi – z̄)2 = 176.09 + 105.47 + 85.93 + 27.77 + 0.07 + 1.61 + 5.15 + 22.37 + 94.67 + 115.13 + 279.89
∑(zi – z̄)2 = 914.15
Step 5: Use the sample variance formula to evaluate the sample variance.
∑(zi – z̄)2 / (N – 1) = 914.15 / 11 – 1
∑(zi – z̄)2 / (N – 1) = 914.15 / 10
∑(zi – z̄)2 / (N – 1) = 91.415
Hence the sample variance of the given sample data is 91.415.
A variance calculator by calculators.tech could be used to avoid time-consuming calculations of variance.
Example 2: For Population Data
Evaluate the average of the squared deviations from the given population data.
Population data = 9, 11, 13, 15, 14, 16, 18, 23, 26, 28, 30
Solution –
Step 1: First of all, find the population average value by taking the quotient of the sum of observations and the total number of data values.
Sum of population data = 9 + 11 + 13 + 15 + 14 + 16 + 18 + 23 + 26 + 28 + 30
Sum = 203
Total number of observation = N = 11
Population Mean = µ = 203/11
Population Mean = µ = 18.455
Step 2: Now find the deviation (difference of each data value from the average).
| Data values | yi – µ |
| 9 | 9 – 18.455 = -9.45 |
| 11 | 11 – 18.455 = -7.45 |
| 13 | 13 – 18.455 = -5.45 |
| 15 | 15 – 18.455 = -3.45 |
| 14 | 14 – 18.455 = -4.45 |
| 16 | 16 – 18.455 = -2.45 |
| 18 | 18 – 18.455 = =0.45 |
| 23 | 23 – 18.455 = 4.55 |
| 26 | 26 – 18.455 = 7.55 |
| 28 | 28 – 18.455 = 9.55 |
| 30 | 30 – 18.455 = 11.55 |
Step 3: Now take the square of the deviations to make all the results positive.
| (yi – µ)2 |
| (-9.45)2 = 89.30 |
| (-7.45)2 = 55.50 |
| (-5.45)2 = 29.70 |
| (-3.45)2 = 11.90 |
| (-4.45)2 = 19.80 |
| (-2.45)2 = 6.00 |
| (=0.45)2 = 0.20 |
| (4.55)2 = 20.70 |
| (7.55)2 = 57.00 |
| (9.55)2 = 91.20 |
| (11.55)2 = 133.40 |
Step 4: Now take the sum of the squared deviations.
∑(zi – µ)2 = 89.30 + 55.50 + 29.70 + 11.90 + 19.80 + 6 + 0.20 + 20.70 + 57 + 91.20 + 133.40
∑(zi – µ)2 = 514.7
Step 5: Use the population variance formula to evaluate the population variance.
∑(zi – µ)2 / N = 514.7 / 11
∑(zi – µ)2 / N = 46.793
Sum Up
The variance is a measure of the variability of the given sample and population data values from the expected values. You have to evaluate the mean, the difference of the data values from the mean, the square of differences, the sum of squared deviation, and the average of the squared deviations to determine the sample or population variance.
Related posts
 Arithmetic Progression Class 10th
 Concept of Critical Value with the help of Different Techniques to find it
 Sum of First n Terms of an Arithmetic Progression Class 10th
 Polynomials Class 10th
 nth Term (General Term) of an Arithmetic Progression Class 10th
 Everything About Microsoft Windows 10.
 About Microsoft office 2016
 Trigonometry Class 10th
 Triangle and its Properties Class 10th
 About Microsoft Office 2013 Pro Plus.
 Quadratic Equation Class 10th
 Midpoint – Definition, Formula, Applications, And Examples
 About Libre office.
बहुपद कक्षा 10 (Polynomial Class 10th)
About Libre office.
बहुपद कक्षा 10 (Polynomial Class 10th)
 About Microsoft Office 2013 Pro Plus Hindi.
 About Microsoft office 2016 Hindi
 Learn Html5
 Learn C Programming
 त्रिकोणमिति कक्षा 10 (The Trigonometry Class 10th)
 About MongoDb Database
 What Is Differential Calculus? Its Definition, Rules, and Examples
 About Pandas
 Coordinate Geometry (Analytical Geometry) Class 10th
 About Python Tableau
 Learn Java Script Programming
 About Microsoft Windows 7.
 Learn Html
 Pair of Linear Equations in Two Variables Class 10th
 What Is Tailwind Css
 समान्तर श्रेढ़ी के पहले n पदों का योग कक्षा 10 (Sum of n Terms of Arithmetic Progression Class 10th)
 Everything About Microsoft Windows 10 Hindi.
 त्रिभुज और इसके गुण कक्षा 10 (The Triangle and its Properties Class 10th)
 About Libre office In Hindi.
निर्देशांक ज्यामिति कक्षा 10 (The Coordinate Geometry Class 10th)
About Libre office In Hindi.
निर्देशांक ज्यामिति कक्षा 10 (The Coordinate Geometry Class 10th)
 About mysql
 About Raspberry pi board
 Learn Java Programming
 About Vue.js
 समान्तर श्रेढ़ी कक्षा 10 (Arithmetic Progressions Class 10th)
 Apache Open Office.
 What Is Bootstrap Css
 Lines and Angles Class 9th
 Geometrical (Graphical) Meaning of the Zeroes of a Polynomial Class 10th
 What Is Bulma Css
 About Xml
 Linux, What is Linux, A Complete Overview of Ubuntu Linux.
 About Scipy Python Library
 About Postgresql
 What is Nodejs
 About Scala Programming
 About ReactJs Framework
 About Json json javascript object notation
 Microsoft Windows 10 Operating System Apps.
 Microsoft Windows Legacy Operating system.
 About Arduino Microcontroller Board
द्विघात समीकरण कक्षा 10 (Quadratic Equations Class 10th)
About Arduino Microcontroller Board
द्विघात समीकरण कक्षा 10 (Quadratic Equations Class 10th)
 Linear Equations in Two Variables Class 9th
 About C# Programming
 Introduction to Euclid’s Geometry Class 9th
 समान्तर श्रेढ़ी का n वाँ पद (व्यापक पद) कक्षा 10 (nth Term of Arithmetic Progression Class 10th)
 बहुपद के शून्यकों का ज्यामितीय (आलेखीय) अर्थ कक्षा 10 [Geometrical (Graphical) Meaning of the Zeroes of the Polynomial Class 10th]
 Coordinate Geometry Class 9th
 What Is Express.js
 Trigonometric Ratios of Some Specific Angles Class 10th
 Heron’s Formula Class 9th
हीरोन का सूत्र कक्षा 9 (Heron’s Formula Class 9th)
Heron’s Formula Class 9th
हीरोन का सूत्र कक्षा 9 (Heron’s Formula Class 9th)
 About Pl/Sql
 Factorization Method Class 10th
 Section Formula Class 10th
 Whole Numbers Class 6th
 Distance Between Two Points in Cartesian Plane and Distance Formula Class 10th
 Perimeter and Area Class 6th
 Sets Class 11th
 What is Linux, A Complete Overview of Ubuntu Linux Hindi.
 Operations on Real Numbers Class 9th
 Cyclic Quadrilaterals Class 10th
 Polynomials Class 9th
 Microsoft Windows 8 Apps.
 वास्तविक संख्याओं पर संक्रियाएँ कक्षा 9वीं (Operations on Real Numbers Class 9th)
 About Microsoft Windows 7 Hindi.
परिमाप और क्षेत्रफल कक्षा 6 (Perimeter and Area for Class 6th)
About Microsoft Windows 7 Hindi.
परिमाप और क्षेत्रफल कक्षा 6 (Perimeter and Area for Class 6th)
 समुच्चय कक्षा 11 (The Sets Class 11th)
 About Python Numpy
 About Joomla Cms
 Representation of Real Numbers on the Number Line Class 9th
 About Sql – Structure Query Language
 About Delphi Programming
 Decimal Numbers Class 7th
 दशमलव संख्याएँ कक्षा 7 (Decimal Number Class 7th)
 Euclid’s Division Lemma Class 10th
 About Kotlin Programming
 Microsoft Windows 10 Apps Hindi.
 What is Angular Js
 About Magento Programming
 Microsoft Windows Legacy Operating System Hindi.
 विभाजन सूत्र कक्षा 10 (The Section Formula Class 10th)
 Tangent and Secant of Circle Class 10th
 वृत्त की स्पर्श रेखा और छेदक रेखा कक्षा 10 (Tangent and Secant of Circles Class 10th)
 निर्देशांक ज्यामिति कक्षा 9 (The Coordinate Geometry Class 9th)
 यूक्लिड की ज्यामिति का परिचय कक्षा 9 (Introduction to Euclid’s Geometry Class 9th)
 About Asp.net
रेखाएँ और कोण कक्षा 9 (Lines and Angles Class 9th)
About Asp.net
रेखाएँ और कोण कक्षा 9 (Lines and Angles Class 9th)
 What Is A Search Engine and Their Type?
 HTML Document Structure
 Type of Variable In C Programming.
 दो चर वाले रैखिक समीकरण युग्म कक्षा 10 (Pair of Linear Equations in Two Variables Class 10th)
 Pc assembly and its operation.
 Pythagoras Theorem (Boudhayana Theorem) Class 10th
 Relationship Between Zeroes and Coefficients of a Quadratic Polynomial Class 10th
 Integers Class 6th
 Quadratic Formula (Shridharacharya Sutra) Class 10th
 About Microsoft office 365.
 दो चरों वाले रैखिक समीकरण कक्षा 9 (Linear Equations of two Variables Class 9th)
 वृत्त की जीवा द्वारा अंतरित कोण कक्षा 10 (Angle Made by a Chord of Circle Class 10th)
 An In-Depth Review of imagestotext.io in 2023
 Microsoft Windows 8 Apps Hindi.
 What Is A Search Engine and Their Type In Hindi?
कार्तीय समतल में दो बिन्दुओं के बीच की दूरी और दूरी सूत्र कक्षा 10 (The Distance Formula Class 10th)
What Is A Search Engine and Their Type In Hindi?
कार्तीय समतल में दो बिन्दुओं के बीच की दूरी और दूरी सूत्र कक्षा 10 (The Distance Formula Class 10th)
 Angle Subtended by a Chord of Circle Class 10th
 Operations on Polynomials Class 10th
 बहुपदों पर संक्रियाएँ कक्षा 10 (Operation on Polynomial Class 10th)
 पूर्णांक संख्याएँ कक्षा 6 (Integer Class 6th)
 Fractions Class 7th
भिन्न संख्याएँ कक्षा 7 (Fraction Class 7th)
पूर्ण संख्याएँ कक्षा 6 (Whole Number Class 6th)
Fractions Class 7th
भिन्न संख्याएँ कक्षा 7 (Fraction Class 7th)
पूर्ण संख्याएँ कक्षा 6 (Whole Number Class 6th)
 बहुपद कक्षा 9वीं (Polynomial Class 9th)
 Decimal Expansions of Real Numbers Class 9th
 Apache Open Office Hindi.
 About Microsoft Windows 8.
 Division Algorithm, Remainder Theorem, and Factor Theorem Class 10th
 About Wps Office.
 Pc assembly and its operation Hindi.
 Growth of the Internet.
 About Objective C Programming
 About Perl Programming
 About Go Programming Language
 What Is Jquery/javascript query
 About Typescript Language
 About Assembly Programming
 HTML Elements
 HTML Elements In Hindi
 HTML Document Structure In Hindi
 The Fundamental Theorem of Arithmetic Class 10th
 Angle Subtended by the Arc of a Circle Class 10th
एक वृत्त के चाप द्वारा अंतरित कोण कक्षा 10 (Angles Made by the Arc of Circle Class 10th)
Angle Subtended by the Arc of a Circle Class 10th
एक वृत्त के चाप द्वारा अंतरित कोण कक्षा 10 (Angles Made by the Arc of Circle Class 10th)
 अंकगणित की आधारभूत प्रमेय कक्षा 10 (Fundamental Theorem of Arithmetic Class 10th)
 Irrational Numbers and Irrationality Class 10th
अपरिमेय संख्या और अपरिमेयता कक्षा 10 (Irrational Number and Irrationality Class 10th)
Irrational Numbers and Irrationality Class 10th
अपरिमेय संख्या और अपरिमेयता कक्षा 10 (Irrational Number and Irrationality Class 10th)
 Decimal Expansion of Rational Numbers Class 10th