A critical value is the test statistic’s value that establishes a confidence interval’s upper and lower boundaries. It explains how far away from the distribution’s mean you must be to account for a specific percentage of the overall variation in the data. For instance, 90%, 95%, and 99%.
Your critical value will be the same in both scenarios if you are creating a 90% confidence interval and utilizing a p = 0.1 as a level of significance. In this article, the basic definition of critical value with formula and also further techniques to find it will be discussed with the help of examples.
What is the Critical Value?
The critical values of a statistical test in statistical hypothesis testing are the limits of the test’s acceptance region. The set of test statistic values for which the null hypothesis is not rejected is known as the acceptance zone. There may be one or many critical values, depending on the geometry of the acceptance region.
In mathematical form it is written as:
Critical value = 1 – (α/2)
Here,
α = 1 – (confidence level / 100)
In order to test the statistical hypothesis, which provides information about the region in the sampling distribution of test statistics, the critical value was an important factor. In hypothesis testing, the critical value and statistical value are compared to determine whether or not the null hypothesis is accepted.
The significance level and test statistic distribution are used to determine any hypothesis’ crucial value. It utilized two tests. Two-tailed and one-tailed hypothesis tests are also used. One-tailed tests have one critical value, as implied by their name, while two-tailed tests have two critical values.
Tests to Determine Critical Values
There are a few important techniques to evaluate the critical values of any specific sample or population. Commonly used techniques to determine the critical values by statisticians are discussed below:
For T-critical Value:
We utilized the T-test for this value, and the T-test Formula shows the value. This method compares the t-score to the crucial value derived from the T-table. If the t-score is smaller, it indicates that the group is similar, and if it is greater, it indicates that the group is different.
T-value can be evaluated by this step shown below:
- First of all, the alpha level will be calculated.
- Subtract 1 from the sample size to get the degree of freedom.
- With the help of a one-tailed T-table, you can evaluate a one-tailed hypothesis and similarly for a two-tailed hypothesis, a two-tailed T-Table will be used.
- Now to find the T-Critical value check the box of df (Left side column) and α-value (top row) of the table. Then the selected box will be its critical value.
The formula for a sample test
T= (Y-µ) / (σ/√ n)
Where y shows the sample mean
- µ is used for the population mean
- σ is used for the standard deviation
- n is used for sample size
For Z-critical Value:
It calculates the z-test that lies on the normal distribution if the sample size is more than or equal to 30 and the standard deviation is known then z-test will apply.
Z-value can be evaluated by following the steps below:
- First of all, the alpha level will be calculated.
- Subtract the α-level from 0.5 for the one-tailed test and 1 from the α-level for two-tailed tests.
- Now using the Z table z critical value will be calculated.
Formula:
Z=(Y-µ) / (σ/√ n)
Where “σ” is the standard deviation and “n” is the sample size here.
For F-critical Value:
It can be calculated with F-test and it is used for the comparison of two samples and test statistics are obtained using regression analysis.
The steps for F-value are mentioned below:
- First of all, the alpha level will be calculated.
- To get the degree of freedom subtract 1 from sample size 1st.
- Similarly, subtract 1 from 2nd sample size to get the degree of freedom.
- Using the F-table you can easily determine F-value.
Formula:
F = (K1)2 / (K2)2
Where K1 and K2 are the standard deviations 1st and 2nd samples respectively.
Chi-square Critical Value:
The chi-square test, which compares sample data with population data, is used to determine this number. This test is used to compare two factors and establish their relationships with one another.
The steps for Chi-value are mentioned below:
- First of all, the alpha level will be calculated.
- Subtract 1 from the sample size to get the degree of freedom.
- With the help of a table, the chi-square value can be calculated.
Examples:
In this section, with the help of examples, the topic will be explained.
Example 1:
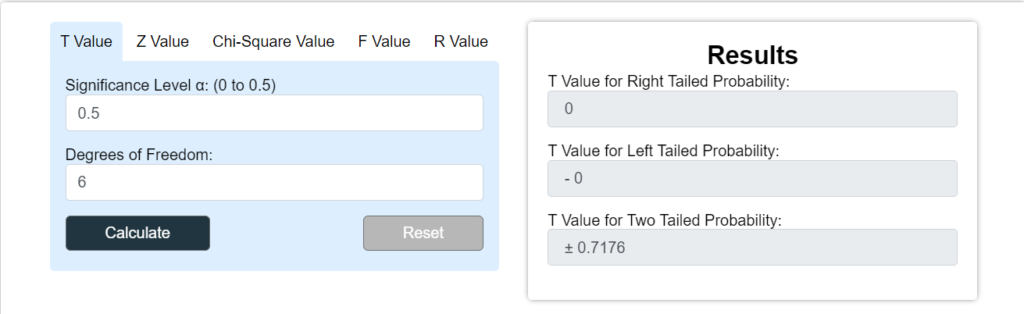
Let the one-tailed T-test apply to a sample whose size is 7 and α=0. 5, then calculate the T-critical value.
Solution:
Step1:
Extract the given data
Sample size = n = 7
Subtract 1 from the sample size to get a degree of freedom (df) = 7 – 1 = 6
Step 2:
To Calculate the value with the help of the T-table.
T (6, 0.5) = ± 0.7176
So, T-critical value = ± 0.7176
Use online tools to cross-check the result of calculated problems. Let us check the result of the above problem.
Example 2:
Let a right-tailed Z-test is applied to the sample whose α-level is 0. 0052. Then find Z-critical Value.
Solution:
Step 1:
Extract the given data
α -level = 0. 0052
Step 2:
Subtract the α-level from 0.5 for a one-tailed test.
Region indication value = 0.5 -0.0052 = 0. 4948
Step 3:
Calculate the Z-interval with the help of the Z-table.
This value lies between an interval of 2.5 and 0.00
Step 4:
Now Add the intervals to get the Z-value
Z-critical value = 2.5 + 0.00 = 2.5
Z-value = 2.5
Summary:
In this article, the basic definition with its formula and a few important techniques are discussed with their formulas and methods to apply them. Furthermore, with the help of examples topic is explained hope you can easily calculate critical values after a complete understanding of this article.
Related posts
 About Libre office.
 About Microsoft office 2016
 Polynomials Class 10th
 Apache Open Office.
 About Microsoft Office 2013 Pro Plus.
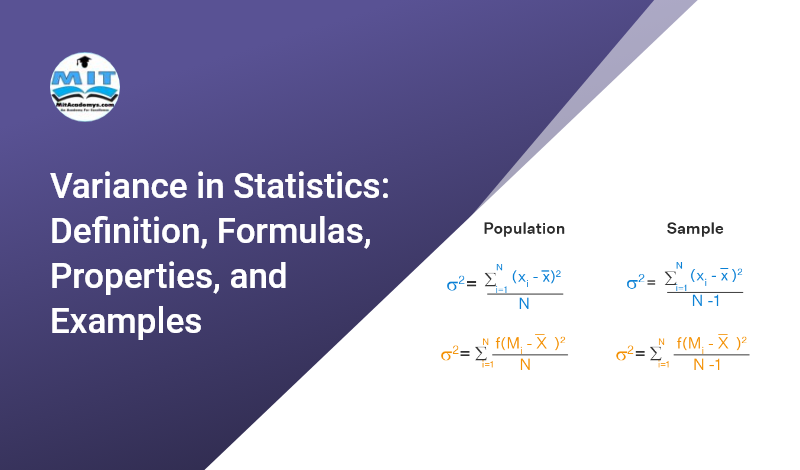
 Variance in Statistics: Definition, Formulas, Properties, and Examples
 About Microsoft office 2016 Hindi
 About Microsoft Office 2013 Pro Plus Hindi.
 Heron’s Formula Class 9th
 Trigonometry Class 10th
 त्रिकोणमिति कक्षा 10 (The Trigonometry Class 10th)
 Everything About Microsoft Windows 10.
 Coordinate Geometry (Analytical Geometry) Class 10th
 Polynomials Class 9th
 About Wps Office.
 About Libre office In Hindi.
 Operations on Real Numbers Class 9th
बहुपद कक्षा 10 (Polynomial Class 10th)
Operations on Real Numbers Class 9th
बहुपद कक्षा 10 (Polynomial Class 10th)
 Quadratic Equation Class 10th
 Arithmetic Progression Class 10th
 Section Formula Class 10th
 Learn Html5
 About Scipy Python Library
 About Python Tableau
 Apache Open Office Hindi.
 Learn Html
 Sum of First n Terms of an Arithmetic Progression Class 10th
 Geometrical (Graphical) Meaning of the Zeroes of a Polynomial Class 10th
 Learn C Programming
 Trigonometric Ratios of Some Specific Angles Class 10th
 Triangle and its Properties Class 10th
 What Is Tailwind Css
 Everything About Microsoft Windows 10 Hindi.
 About MongoDb Database
 Distance Between Two Points in Cartesian Plane and Distance Formula Class 10th
हीरोन का सूत्र कक्षा 9 (Heron’s Formula Class 9th)
Distance Between Two Points in Cartesian Plane and Distance Formula Class 10th
हीरोन का सूत्र कक्षा 9 (Heron’s Formula Class 9th)
 कुछ विशिष्ट कोणों के लिए त्रिकोणमितीय अनुपात कक्षा 10 (Trigonometric Ratios of Specific Angles Class 10th)
 Learn Java Script Programming
 Pair of Linear Equations in Two Variables Class 10th
 Operations on Polynomials Class 10th
 nth Term (General Term) of an Arithmetic Progression Class 10th
 About Microsoft Windows 7.
 About Postgresql
निर्देशांक ज्यामिति कक्षा 10 (The Coordinate Geometry Class 10th)
About Postgresql
निर्देशांक ज्यामिति कक्षा 10 (The Coordinate Geometry Class 10th)
 Learn Java Programming
 Operators In C Language.
 About mysql
 About Raspberry pi board
 Fractions Class 7th
 बहुपद के शून्यकों का ज्यामितीय (आलेखीय) अर्थ कक्षा 10 [Geometrical (Graphical) Meaning of the Zeroes of the Polynomial Class 10th]
 Microsoft Windows 10 Operating System Apps.
 Division Algorithm, Remainder Theorem, and Factor Theorem Class 10th
 विभाजन सूत्र कक्षा 10 (The Section Formula Class 10th)
 About Scala Programming
कार्तीय समतल में दो बिन्दुओं के बीच की दूरी और दूरी सूत्र कक्षा 10 (The Distance Formula Class 10th)
About Scala Programming
कार्तीय समतल में दो बिन्दुओं के बीच की दूरी और दूरी सूत्र कक्षा 10 (The Distance Formula Class 10th)
 Operators In C Programming Hindi.
 दो चर वाले रैखिक समीकरण युग्म कक्षा 10 (Pair of Linear Equations in Two Variables Class 10th)
 What is Nodejs
 About Pl/Sql
 What Is Express.js
 What Is Bootstrap Css
 About Vue.js
 Zeroes of the Polynomials Class 10th
 What Is Bulma Css
 About Json json javascript object notation
 Microsoft Windows Legacy Operating system.
 Decimal Numbers Class 7th
 About C# Programming
 Microsoft Windows 8 Apps.
 Quadratic Formula (Shridharacharya Sutra) Class 10th
 About ReactJs Framework
 About Arduino Microcontroller Board
 Linear Equations in One Variable Class 8th
 Coordinate Geometry Class 9th
 Integers Class 6th
 समान्तर श्रेढ़ी कक्षा 10 (Arithmetic Progressions Class 10th)
द्विघात समीकरण कक्षा 10 (Quadratic Equations Class 10th)
समान्तर श्रेढ़ी कक्षा 10 (Arithmetic Progressions Class 10th)
द्विघात समीकरण कक्षा 10 (Quadratic Equations Class 10th)
 Whole Numbers Class 6th
 Linear Equations in Two Variables Class 9th
 About Sql – Structure Query Language
 Squares and Square Roots Class 8th
 Perimeter and Area Class 6th
 Linux, What is Linux, A Complete Overview of Ubuntu Linux.
 About Python Numpy
 Data Type In C Programming.
 Pc assembly and its operation.
 Data Type In C Programming Hindi.
 About Xml
 Areas Related to Circles Class 10th
 Midpoint – Definition, Formula, Applications, And Examples
 Area of Triangle in Coordinate Geometry Class 10th
 About Microsoft office 365.
 About Go Programming Language
 About Magento Programming
 About Joomla Cms
 त्रिभुज और इसके गुण कक्षा 10 (The Triangle and its Properties Class 10th)
 Sets Class 11th
 Type of Variable In C Programming.
 About Pandas
 About Typescript Language
 Representation of Real Numbers on the Number Line Class 9th
 समुच्चय कक्षा 11 (The Sets Class 11th)
 वास्तविक संख्याओं पर संक्रियाएँ कक्षा 9वीं (Operations on Real Numbers Class 9th)
 Algebra Q & A
 About Asp.net
 About Microsoft Windows 8.
परिमाप और क्षेत्रफल कक्षा 6 (Perimeter and Area for Class 6th)
About Microsoft Windows 8.
परिमाप और क्षेत्रफल कक्षा 6 (Perimeter and Area for Class 6th)
 HTML Elements
 About Kotlin Programming
 About Microsoft Windows 7 Hindi.
 वर्ग और वर्गमूल कक्षा 8 (Square and Square Root Class 8th)
 दशमलव संख्याएँ कक्षा 7 (Decimal Number Class 7th)
 समान्तर श्रेढ़ी के पहले n पदों का योग कक्षा 10 (Sum of n Terms of Arithmetic Progression Class 10th)
 What is Linux, A Complete Overview of Ubuntu Linux Hindi.
 About Perl Programming
 Euclid’s Division Lemma Class 10th
 Decimal Expansion of Rational Numbers Class 10th
 Tangent and Secant of Circle Class 10th
 Decimal Expansions of Real Numbers Class 9th
 वृत्त की स्पर्श रेखा और छेदक रेखा कक्षा 10 (Tangent and Secant of Circles Class 10th)
 निर्देशांक ज्यामिति कक्षा 9 (The Coordinate Geometry Class 9th)
 Probability Class 10th
 Microsoft Windows 10 Apps Hindi.
 What Is A Search Engine and Their Type?
 Type of Variable In C Programming In Hindi.
 HTML Elements In Hindi
 Mensuration Q & A
 About Delphi Programming
 बहुपद कक्षा 9वीं (Polynomial Class 9th)
 HTML Document Structure
 Computer Motherboard and its Components.
 समान्तर श्रेढ़ी का n वाँ पद (व्यापक पद) कक्षा 10 (nth Term of Arithmetic Progression Class 10th)
 दो चरों वाले रैखिक समीकरण कक्षा 9 (Linear Equations of two Variables Class 9th)
 Introduction to Euclid’s Geometry Class 9th
 यूक्लिड की ज्यामिति का परिचय कक्षा 9 (Introduction to Euclid’s Geometry Class 9th)
 Microsoft Windows Legacy Operating System Hindi.
 What Is A Search Engine and Their Type In Hindi?
 About Matlab Programming
 What Is Differential Calculus? Its Definition, Rules, and Examples
 About Objective C Programming
 10 Approved Steps for Choosing the Best Web Design that Fit for Your Business
 Angle Subtended by a Chord of Circle Class 10th
 वृत्त की जीवा द्वारा अंतरित कोण कक्षा 10 (Angle Made by a Chord of Circle Class 10th)
 What is Angular Js
 C language Algorithms, Flowchart, and Terms.
 The Fundamental Theorem of Arithmetic Class 10th
 What Is Jquery/javascript query
 Microsoft Windows 8 Apps Hindi.
 Lines and Angles Class 9th

I do not even understand how I ended up here, but I assumed this publish used to be great
I like the efforts you have put in this, regards for all the great content.
I truly appreciate your technique of writing a blog. I added it to my bookmark site list and will
This is really interesting, You’re a very skilled blogger. I’ve joined your feed and look forward to seeking more of your magnificent post. Also, I’ve shared your site in my social networks!
I very delighted to find this internet site on bing, just what I was searching for as well saved to fav
For the reason that the admin of this site is working, no uncertainty very quickly it will be renowned, due to its quality contents.
very informative articles or reviews at this time.
You’re so awesome! I don’t believe I have read a single thing like that before. So great to find someone with some original thoughts on this topic. Really.. thank you for starting this up. This website is something that is needed on the internet, someone with a little originality!
I am truly thankful to the owner of this web site who has shared this fantastic piece of writing at at this place.
very informative articles or reviews at this time.
I just like the helpful information you provide in your articles
Pretty! This has been a really wonderful post. Many thanks for providing these details.
This is really interesting, You’re a very skilled blogger. I’ve joined your feed and look forward to seeking more of your magnificent post. Also, I’ve shared your site in my social networks!
very informative articles or reviews at this time.
Hi there to all, for the reason that I am genuinely keen of reading this website’s post to be updated on a regular basis. It carries pleasant stuff.
I’m often to blogging and i really appreciate your content. The article has actually peaks my interest. I’m going to bookmark your web site and maintain checking for brand spanking new information.
HTML Meta Tag thanks أكبر شركة لانتاج أنابيب البولي ايثيلين و يو بي سي ومستلزماتها للمنتجات الصناعية في عيراق
Pretty! This has been a really wonderful post. Many thanks for providing these details.
whoah this weblog is great i like studying your articles.
Stay up the good work! You realize, lots of people are hunting
around for this information, you can help
them greatly.
Engaging and thought-provoking, I thoroughly enjoyed reading it!
I am truly thankful to the owner of this web site who has shared this fantastic piece of writing at at this place.
very informative articles or reviews at this time.
Engaging and thought-provoking, I thoroughly enjoyed reading it!
This is my first time pay a quick visit at here and i am really happy to read everthing at one place
I like the efforts you have put in this, regards for all the great content.
I appreciate you sharing this blog post. Thanks Again. Cool.
Such valuable insights packed into a concise article.
I do not even understand how I ended up here, but I assumed this publish used to be great
I really like reading through a post that can make men and women think. Also, thank you for allowing me to comment!
跨境电商独立建站定制版,想怎么做就怎么做,自有平台我做主,不限于人,品牌沉淀的利器!
I very delighted to find this internet site on bing, just what I was searching for as well saved to fav
For the reason that the admin of this site is working, no uncertainty very quickly it will be renowned, due to its quality contents.
Pretty! This has been a really wonderful post. Many thanks for providing these details.
Pretty! This has been a really wonderful post. Many thanks for providing these details.
This website is a treasure trove of intellectual gems, a testament to the administrator’s passion for knowledge and their commitment to sharing valuable insights. Each article is a masterpiece, meticulously crafted to educate, inspire, and challenge readers. The depth of research, the clarity of thought, and the engaging writing style are a testament to the administrator’s expertise in the subject matter. This website has become my go-to resource for expanding my understanding and staying intellectually stimulated. I am deeply grateful for the administrator’s dedication to delivering exceptional content that nourishes the mind, ignites curiosity, and encourages continuous learning. Their unwavering commitment to providing a platform that enriches the lives of its readers is truly commendable.
It’s actually a nice and helpful piece of info. I’m satisfied that you
just shared this helpful information with us.
Please stay us informed like this. Thanks for sharing.
Awesome! Its genuinely remarkable post, I have got much clear idea regarding from this post
Your dedication to delivering high-quality content is evident in every post. I admire your commitment to providing value to your readers. Thank you for the time and effort you invest in your blog.
Pretty! This has been a really wonderful post. Many thanks for providing these details.
For the reason that the admin of this site is working, no uncertainty very quickly it will be renowned, due to its quality contents.
Grundriss Haus beantragen: Beantragen Sie einen offiziellen Grundriss für Ihr Hausprojekt.
You’re so awesome! I don’t believe I have read a single thing like that before. So great to find someone with some original thoughts on this topic. Really.. thank you for starting this up. This website is something that is needed on the internet, someone with a little originality!
Your blog has become my go-to resource for [topic]. The depth of knowledge you share is unparalleled, and I’m grateful for the effort you put into each post. Thank you for being a trusted authority.
Hi there to all, for the reason that I am genuinely keen of reading this website’s post to be updated on a regular basis. It carries pleasant stuff.
I’m often to blogging and i really appreciate your content. The article has actually peaks my interest. I’m going to bookmark your web site and maintain checking for brand spanking new information.
Wow, amazing blog layout! How long have you been blogging for? you made blogging look easy. The overall look of your web site is magnificent, as well as the content!
Keep this going please, great job!